Home and Commercial Property Loans in Malaysia, Jan–Sep 2026: What BNM’s Latest Data Means for KL and Selangor Buyers, Owners and Investors
Bank Negara Malaysia’s September 2026 statistics show residential loan applications edging up, approvals and disbursements slightly lower, and non-residential (commercial and industrial) lending growing faster. Here is what the national numbers do and do not tell you, and how to use them when you plan a purchase, refinance or business premises.
Also on Medium: read it on Medium
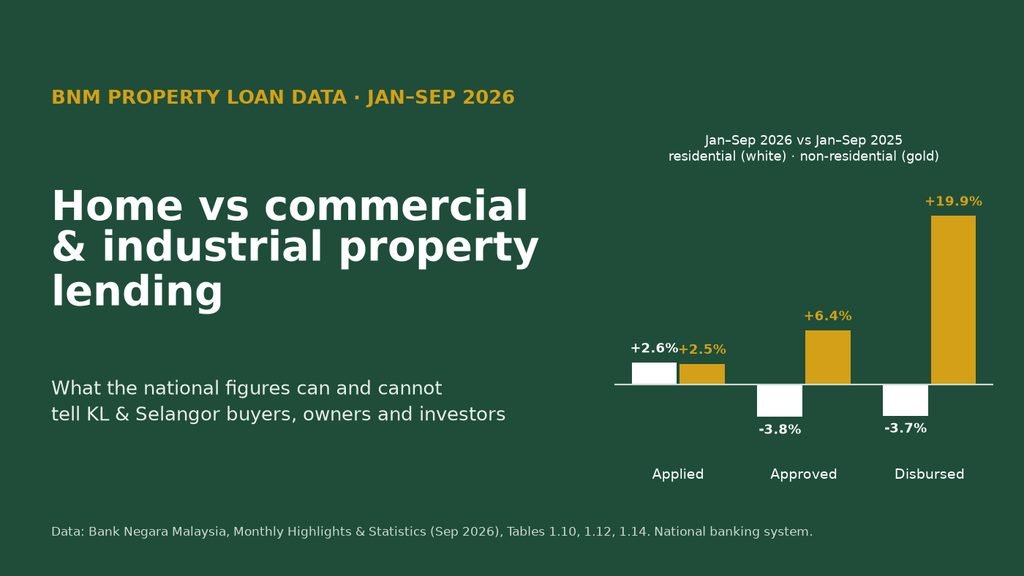
In my OPR article, I wrote about Bank Negara Malaysia’s decision on 5 November 2026 to hold the Overnight Policy Rate (OPR) at 2.75%. That article was about the price of borrowing. This one is about the flow of borrowing: how much Malaysians applied for, how much banks approved and paid out, and how much property debt is outstanding, for both homes and non-residential property such as shophouses, factories, land and commercial buildings.
The most recent figures available are in Bank Negara Malaysia’s Monthly Highlights & Statistics for September 2026, which covers data up to September 2026. When I checked on 7 November 2026, no October 2026 loan tables had been published, so this article covers January to September 2026 and compares it with the same nine months of 2025.
Read this first: what this data is and is not
- It is national. Every figure here is for the Malaysian banking system as a whole (commercial, Islamic and investment banks). The tables I use are not broken down by state, so none of these numbers are Kuala Lumpur or Selangor figures. Where I discuss KL and Selangor, I am talking about how to apply national trends locally, not reporting local data.
- It is about loans, not transactions or prices. Outstanding loans are a stock of debt built up over many years. They do not count how many properties changed hands. For transactions and prices, NAPIC (JPPH) is the official source.
- Approvals are not your odds. The ratio of loans approved to loans applied is a ratio of total ringgit values in the same period. It is not the share of applicants who succeed, and it says nothing about your own application.
- Not advice. This is general information. Please speak to your bank and, where relevant, a licensed financial adviser or lawyer before you commit.
The short version
All figures below are for the national banking system, in RM, from BNM Monthly Highlights & Statistics (September 2026), Tables 1.10, 1.12, 1.14 and 1.19. The year-to-date (YTD) figures are my own sums of BNM’s monthly values.
Residential property (purchase of homes):
- Applied, Jan–Sep 2026: RM363.4 billion, up 2.6% from RM354.1 billion in Jan–Sep 2025.
- Approved, Jan–Sep 2026: RM139.4 billion, down 3.8% from RM145.0 billion.
- Disbursed, Jan–Sep 2026: RM88.7 billion, down 3.7% from RM92.1 billion.
- Outstanding, end-September 2026: RM929.2 billion, up 5.3% from RM882.4 billion a year earlier.
Non-residential property (shophouses, industrial buildings, land, commercial complexes and others):
- Applied, Jan–Sep 2026: RM139.3 billion, up 2.5% from RM135.9 billion.
- Approved, Jan–Sep 2026: RM71.8 billion, up 6.4% from RM67.4 billion.
- Disbursed, Jan–Sep 2026: RM66.9 billion, up 19.9% from RM55.8 billion.
- Outstanding, end-September 2026: RM307.2 billion, up 7.8% from RM284.9 billion.
In plain terms, home-loan demand in ringgit terms was a little higher than last year, while the value of new home loans approved and paid out was a little lower. Non-residential lending rose at every stage, with disbursements up most sharply. The outstanding stock of both kinds of property debt kept growing.
Where the numbers come from, and the exact definitions
Everything in this article comes from four Excel tables in the Bank Negara Malaysia Monthly Highlights & Statistics, September 2026 release (BNM page, downloaded 7 November 2026):
- Table 1.10, Banking System: Loan/Financing Applied by Purpose: the value of loan and financing applications.
- Table 1.12, Banking System: Loan/Financing Approved by Purpose: the value of loans and financing approved.
- Table 1.14, Banking System: Loan/Financing Disbursed by Purpose: the value of loans and financing actually paid out.
- Table 1.19, Banking System: Loan/Financing by Purpose: the value of loans and financing outstanding at the end of each month.
All four are in RM million. Each month has a row for commercial banks, Islamic banks, investment banks and a total. I use the total, which is what BNM calls the banking system. Applications, approvals and disbursements are monthly flows. Outstanding loans are an end-of-month stock.
BNM’s glossary for these tables defines the two property purposes as follows (quoted from the September 2026 release page):
- Purchase of Residential Property: “loans/financing granted for the purchase or refinancing the purchase of residential property for human dwelling purposes”, including housing loans sold to Cagamas with recourse, classified into bands of RM300,000 and below, RM300,001–RM500,000, RM500,001–RM1,000,000, and more than RM1,000,000.
- Purchase of Non-Residential Property: “loans/financing granted for the purchase and refinancing of the purchase of non-residential property”, meaning property “not used for human dwelling purposes”. BNM lists industrial buildings, factories, land, commercial complexes, warehouses, SoFo and SoVo units “and other structures not meant for human dwelling”.
Three points follow from these definitions:
- Refinancing is included. A refinance of an existing home loan counts as residential lending, so the flows are not purely new purchases.
- SoFo and SoVo units are non-residential in BNM’s classification, even though some people live in them. If you are financing one, your bank may treat it as commercial property.
- The bands in Table 1.19 are labelled “Cost” (in Malay, “Harga”). I report them exactly as BNM labels them and do not convert them into home prices or loan sizes.
Residential loans: applications up, approvals and payouts slightly down
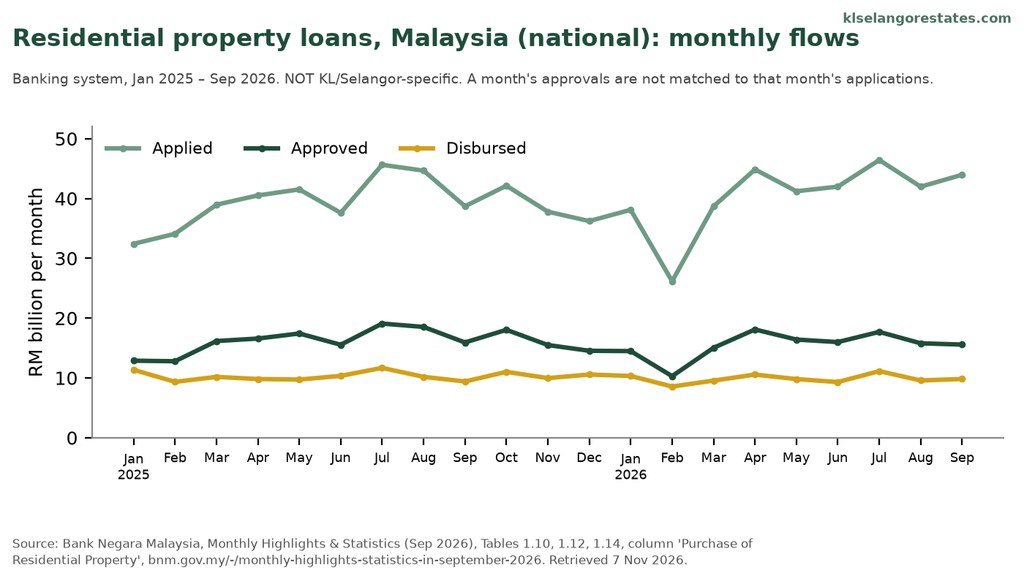
Residential property loans applied, approved and disbursed each month, Malaysia (national banking system), January 2025 to September 2026. Source: BNM Monthly Highlights & Statistics (Sep 2026), Tables 1.10, 1.12, 1.14.
Applications. Malaysians applied for RM363.4 billion of residential loans in January–September 2026, against RM354.1 billion a year earlier (+2.6%). In September 2026 alone the figure was RM44.0 billion, 13.6% above September 2025 (RM38.7 billion) and 4.7% above August 2026 (RM42.0 billion). The highest month this year was July 2026 (RM46.4 billion). The lowest was February 2026 (RM26.2 billion). Monthly figures can swing, so I would not read too much into any single month.
Approvals. Banks approved RM139.4 billion of residential loans in January–September 2026, down 3.8% from RM145.0 billion. September 2026 approvals were RM15.6 billion, 2.2% below September 2025 (RM15.9 billion).
Disbursements. Banks paid out RM88.7 billion in January–September 2026, down 3.7% from RM92.1 billion. September 2026 disbursements were RM9.8 billion, up 4.4% from a year earlier.
Approval-to-application value ratio. If you divide the value approved by the value applied over the same nine months, you get 38.4% for 2026, against 40.9% for Jan–Sep 2025. Please read this carefully:
- It compares ringgit totals, not numbers of people or files.
- A loan approved in September may have been applied for in July, and many buyers apply to several banks for the same property, which inflates the applications total.
- So the ratio is not a measure of your chance of approval, and a lower ratio does not prove banks have become stricter. It can also move because of the mix of applications, duplicate applications, withdrawals and timing.
It also helps to know why disbursements differ from approvals. Disbursement is when money actually leaves the bank. Depending on the purchase, the bank may release funds in one go or in stages (for example, as a property under construction progresses). So disbursements in a month are not the same loans as the approvals in that month. Some approved loans may never be drawn down, for example if a purchase does not proceed or the buyer accepts another bank’s offer.
What has been held constant: the OPR
The OPR has been 2.75% since BNM’s cut on 9 July 2025, and it was held at every meeting through 5 November 2026 (BNM OPR decisions). That means the policy rate behind floating-rate loans was the same for the whole January–September 2026 period I am comparing. Because the rate did not change, these figures cannot show how borrowers respond to a rate move. Any differences from 2025 reflect many things at once, including income, prices, bank credit policies, the supply of new projects and the timing of completions. I am not attributing them to the OPR.
Outstanding home loans: still growing, mostly in the middle bands
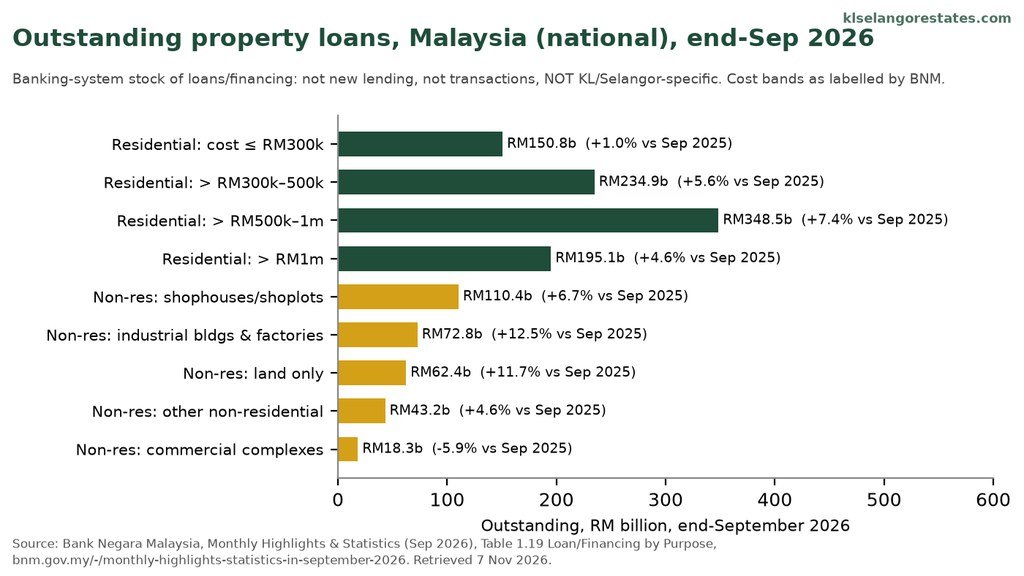
Outstanding property loans by type, Malaysia (national banking system), end-September 2026, with change from end-September 2025. This is a stock of debt, not new lending or transactions. Source: BNM Monthly Highlights & Statistics (Sep 2026), Table 1.19.
At the end of September 2026, outstanding residential property loans in the banking system stood at RM929.2 billion. That is:
- +5.3% from end-September 2025 (RM882.4 billion);
- +3.8% (RM34.0 billion) from end-December 2025 (RM895.2 billion); and
- 37.7% of all banking-system loans and financing outstanding (RM2,466.3 billion).
By BNM’s cost bands, the RM929.2 billion breaks down as:
- RM300,000 and below: RM150.8 billion (16.2% of residential), +1.0% year on year.
- Above RM300,000 to RM500,000: RM234.9 billion (25.3%), +5.6%.
- Above RM500,000 to RM1 million: RM348.5 billion (37.5%), +7.4%.
- Above RM1 million: RM195.1 billion (21.0%), +4.6%.
Before rounding, the four bands sum to the residential total. Of the total, RM30.7 billion is housing loans sold to Cagamas, 5.7% lower than a year earlier.
Does a growing stock mean a mortgage “boom”? Not necessarily. The outstanding figure changes with new disbursements and repayments, but also with other adjustments such as write-offs, loans sold or transferred, and reclassifications. So a 5.3% rise in outstanding residential loans alongside a 3.8% fall in approvals is not, on its own, proof of any particular lending trend. It is a stock built up over many years, and it moves slowly.
Using the cost bands. The bands are national, so they cannot tell you how much lending is in KL or Selangor. If you are buying or refinancing, find the BNM band that matches your own purchase and watch how that band changes from month to month. Do not treat it as a picture of your local market.
Non-residential loans: the stronger story in 2026
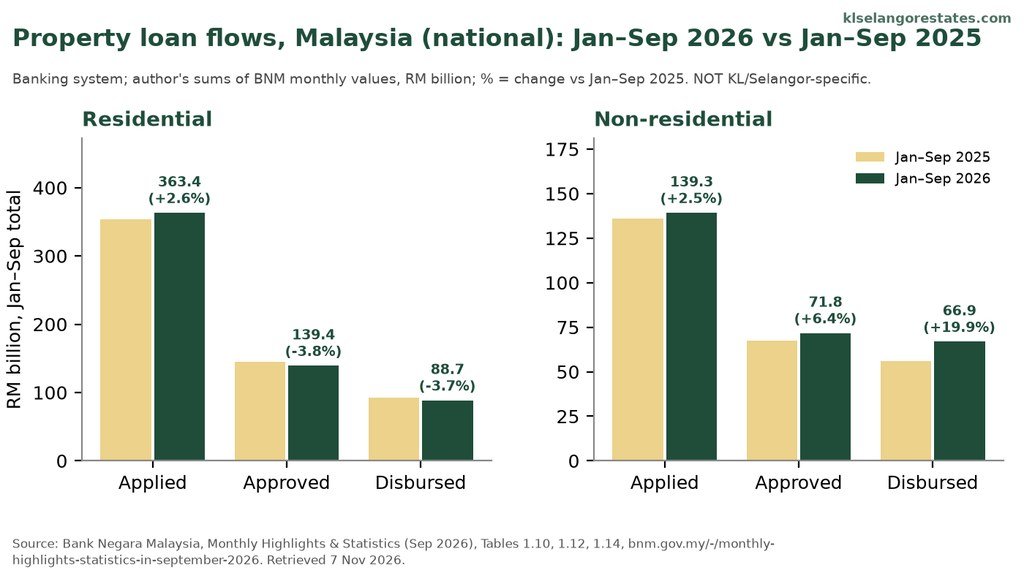
Residential and non-residential property loan flows, January–September 2026 versus January–September 2025, Malaysia (national banking system). Year-to-date totals are the author’s sums of BNM monthly figures. Source: BNM Monthly Highlights & Statistics (Sep 2026), Tables 1.10, 1.12, 1.14.
Non-residential property lending covers shophouses, shoplots, offices in commercial complexes, factories, warehouses, land and SoFo/SoVo units. In January–September 2026:
- Applied: RM139.3 billion, +2.5% from RM135.9 billion.
- Approved: RM71.8 billion, +6.4% from RM67.4 billion.
- Disbursed: RM66.9 billion, +19.9% from RM55.8 billion.
The monthly figures were strong in September 2026. Approvals reached RM9.8 billion, 26.4% above September 2025 (RM7.8 billion), and disbursements were RM8.0 billion, 16.5% higher than a year earlier (RM6.9 billion).
The approval-to-application value ratio for non-residential loans was 51.5% in Jan–Sep 2026 against 49.6% a year earlier. The same health warning applies: it is an aggregate value ratio, not a success rate for any borrower.
Outstanding non-residential loans stood at RM307.2 billion at end-September 2026, +7.8% year on year and 12.5% of all banking-system loans. By type:
- Shophouses/shoplots: RM110.4 billion (35.9% of non-residential), +6.7%.
- Industrial buildings and factories: RM72.8 billion (23.7%), +12.5%.
- Land only: RM62.4 billion (20.3%), +11.7%.
- Other non-residential property: RM43.2 billion (14.1%), +4.6%.
- Commercial complexes: RM18.3 billion (6.0%), −5.9%.
Again, these are stocks of debt. BNM classifies these loans by purpose (what the money is used for), not by the collateral. So faster growth in the “industrial buildings & factories” line means more outstanding financing for buying or refinancing such property nationally. It does not tell you how many factories were sold in Selangor, or at what price. For that, look to NAPIC’s transaction data.
One more caution: non-residential disbursement data includes business borrowers of all kinds, and a few large loans can move a single month. The nine-month figures are more reliable than any one month.
What this means if you are buying a home in KL or Selangor
National data cannot predict your own loan outcome, but it does help you plan. Here is how I would use it:
- Prepare your documents early. Have your recent payslips or business income records, your EA form or tax return, your EPF statement, bank statements and your CCRIS and CTOS reports ready before you commit to a purchase. Ask your bank which documents it needs, because requirements differ.
- Ask how your bank assesses affordability. Banks look at your existing monthly commitments against your income. Ask how they calculate this (often called the debt service ratio, or DSR), which commitments they count, and whether changing any existing facilities would make a difference in your case.
- Choose banks deliberately. Many buyers apply to more than one bank. Ask each bank how an application is recorded and what it means for your credit report. Multiple applications for the same property are also one reason the national applications total is not an approval rate.
- Understand how and when funds are released. Ask your bank and lawyer when the loan will be disbursed for your type of purchase, and how interest is charged before full release. Budget separately for the downpayment, legal fees, stamp duty and valuation.
- Check how your loan is priced. New retail floating-rate loans are priced off the Standardised Base Rate (SBR), which is linked to the OPR and has been 2.75% since July 2025. Older floating loans may still be priced off a bank’s Base Rate or Base Lending Rate, and fixed-rate loans work differently. Compare the effective lending rate and the full terms, including lock-in periods and fees. My OPR article has an illustrative instalment example.
What this means if you already own a home
- Refinancing is part of these figures. BNM’s residential definition includes refinancing. If you are thinking of refinancing to get a lower spread or release equity, run the numbers on the total cost, including legal fees, valuation, any lock-in penalty on your existing loan and the new lock-in period.
- Outstanding debt growth is not a price signal. Rising outstanding home loans nationally does not mean your property has gone up in value. For a value, get a bank-panel valuation or check recent transactions on NAPIC.
- Know your loan. Check whether your loan is fixed or floating, and which reference rate it is priced off (the SBR for new retail floating loans, or an older Base Rate or Base Lending Rate), and what your current effective rate is. Your bank statement or loan agreement will show this.
What this means for investors and landlords
- Rental yield is your own calculation. National lending data tells you nothing about rents in a particular KL or Selangor building. Keep two different measures apart. Net rental yield (before financing) is annual rent, less vacancy and running costs such as maintenance and sinking fund, assessment tax, quit rent and insurance, divided by the purchase cost or current value. Cash flow after financing is that net rent minus your actual loan instalments, which include principal as well as interest. A property can have a reasonable net yield and still have negative monthly cash flow.
- Ask whether terms differ for additional properties. If you already have housing loans, ask your bank whether the margin of financing or the way it counts rental income would be different for this purchase. Do not assume you will get the same terms as last time.
- Stress-test the rate. Rates were stable in 2026, but they can change at future MPC meetings. Check that the investment still works if your instalment rises.
What this means if you are buying a shophouse, office or factory
The national data shows stronger non-residential lending in 2026, but that does not tell you how any one application will be treated. Commercial and industrial financing can be assessed quite differently from a home loan. Use this as a checklist of questions for your bank, lawyer and accountant:
- Personal or company name? Ask the bank what it will assess in each case (for example your personal income, or the company’s accounts and cash flow) and whether directors would be asked for personal guarantees.
- Margin and tenure. Ask what margin of financing and maximum tenure the bank would offer for this specific property and borrower, and get indicative terms in writing. Do not assume they will be the same as for a home loan.
- The property’s documents. Ask your lawyer to check the title, tenure and any remaining lease, land use category and express conditions, and, for buildings, the approvals and certificate of completion and compliance (CCC). Ask the bank whether any of these affect financing.
- Owner-occupiers: does the business case work? Compare the instalment and running costs with renting, and think about how much working capital the purchase would tie up.
- Investors: what does the bank look at in the income? Ask whether the bank will consider existing tenancies, lease terms and the rent roll when it values the property and assesses the loan.
- SoFo/SoVo units. BNM’s statistics classify these as non-residential. If you plan to live in one or let it as a home, ask the bank how it will classify and finance the unit.
What to watch next
- BNM’s next Monthly Highlights & Statistics, covering October 2026, is likely around the end of November 2026, going by the timing of the September release (published at the end of October). I will check whether the residential and non-residential trends continue into October.
- NAPIC property market data, which covers transactions, values and supply, including state-level figures for KL and Selangor. That is where to look for actual local activity.
- The next MPC meeting on 21 January 2027, as published with BNM’s statement of 5 November 2026. Any change to the OPR would flow through to the SBR and floating-rate loans.
Related reading
Sources
All data was retrieved on 7 November 2026. Year-to-date sums, percentage changes, shares and ratios are my own calculations from BNM’s published monthly figures.
- Bank Negara Malaysia: Monthly Highlights & Statistics in September 2026 (release page with table downloads and Glossary)
- Table 1.10, Banking System: Loan/Financing Applied by Purpose (XLSX): columns “Purchase of Residential Property”, “Purchase of Non-Residential Property” and “Total Loan/Financing Applied”
- Table 1.12, Banking System: Loan/Financing Approved by Purpose (XLSX)
- Table 1.14, Banking System: Loan/Financing Disbursed by Purpose (XLSX)
- Table 1.19, Banking System: Loan/Financing by Purpose (XLSX): outstanding loans, including residential cost bands and non-residential property types
- Bank Negara Malaysia: OPR Decisions
About the author
Jessica Leong | Registered Estate Agent E3208
PropNex Realty Sdn Bhd (E (1) 1800/1), KLCC branch. Jessica covers new launch condos in Kuala Lumpur and Selangor, industrial property in Selangor, bank auction (lelong) properties, and Selangor offices, shophouses and en-bloc deals.
PropNex Realty Sdn Bhd, A-G-03, Marc Residence, No. 3, Jalan Pinang, 50400 Kuala Lumpur
Office: 03-2161 8608 · Call/WhatsApp: 010-464 6088
Website: klselangorestates.com
This article is general information based on Bank Negara Malaysia statistics published up to 7 November 2026 (data to September 2026). All loan figures are national banking-system totals and are not specific to Kuala Lumpur or Selangor. Ratios of approved to applied values are aggregate figures, not approval rates for any individual. It is not legal, tax, financial, valuation or investment advice. Please confirm terms with your own bank.