Office Space in KL and Selangor, H1 2026: Occupancy Near 72%, Rents Flat. What NAPIC's Data Means for Tenants Renewing in 2027
NAPIC's office rental index shows Kuala Lumpur occupancy up to 72.6% and Selangor steady at 71.8%, while average rents barely moved. Here is what the official numbers say by submarket, what they do not show, and how tenants and owners can use them in 2027 lease talks.
Also on Medium: read it on Medium

If your office lease in Kuala Lumpur or Selangor comes up for renewal in 2027, or you are thinking of moving, the talks with landlords will start soon. Before they do, it helps to know what the official data says about the market you are negotiating in.
The best neutral source is the Purpose-Built Office Rental Index (PBO-RI) from NAPIC, the National Property Information Centre under the Valuation and Property Services Department (JPPH). Its latest report, for the first half of 2026, was dated 7 September 2026. The short version:
- More space is occupied in Kuala Lumpur, but more than a quarter of the space in NAPIC’s figures is still empty.
- Selangor is steady, with Seri Kembangan well below the rest.
- Average rents have barely moved: the index is up less than 1% on a year earlier in every Klang Valley submarket.
This article goes through the numbers submarket by submarket, explains what they do and do not tell you, and ends with practical checklists for tenants renewing or relocating in 2027 and for owners pricing space in PJ/Subang Jaya, Shah Alam and Seri Kembangan.
Not advice. This is general information from NAPIC (JPPH), the Ministry of Finance and the Stamp Act 1949 as amended, as at 31 October 2026. NAPIC’s Q2 2026 figures are preliminary and may be revised. The averages here describe NAPIC’s purpose-built office data, not the asking rent of any particular building. This article does not discuss or recommend any particular building or development. Please get your own legal and tax advice before you sign a lease.
The numbers in one minute
All figures are for Q2 2026 (preliminary), from NAPIC’s PBO-RI report, unless stated otherwise.
- Kuala Lumpur occupancy: 72.6%, up from 70.9% in Q4 2025. City Centre 74.1%, Outside City Centre 67.3%.
- Selangor occupancy: stable at 71.8%. Shah Alam 73.1% (down from 74.4% in Q4 2025), Petaling Jaya/Subang Jaya 71.1% (up from 71.0%), Seri Kembangan 61.4%.
- Average rent, RM per sq m a month: KL City Centre RM56.40, KL Outside City Centre RM49.51, PJ/Subang Jaya RM49.41, Shah Alam RM45.10, Seri Kembangan RM44.89. Kuala Lumpur overall RM54.68, Selangor RM46.50, Klang Valley RM49.08.
- Rental index, change on a year earlier: Kuala Lumpur +0.4%, Selangor +0.6%, Klang Valley +0.5%. Seri Kembangan +0.8%, Shah Alam +0.3%, PJ/Subang Jaya +0.2%.
- Change on the previous quarter: Kuala Lumpur +0.2% and Selangor +0.2%.
What NAPIC’s office index measures
The PBO-RI tracks purpose-built office buildings, meaning office blocks built as offices, in the Klang Valley, Johor Bahru and George Town. For the Klang Valley, NAPIC splits Kuala Lumpur into City Centre (CC) and Outside City Centre (OCC), and Selangor into Petaling Jaya/Subang Jaya (PJ/SJ), Shah Alam (SA) and Seri Kembangan (SK).
For each area it publishes three things:
- an index, which shows how rents have moved over time,
- the average rental, in ringgit per square metre a month, and
- the occupancy rate.
The report does not name the buildings behind each average, and it does not publish rents for any single building. The report’s own figures are in RM per square metre (p.s.m.). Where I show RM per square foot (psf), it is my own conversion, dividing by 10.764, and labelled “calc”.
Occupancy: Kuala Lumpur up, Selangor steady
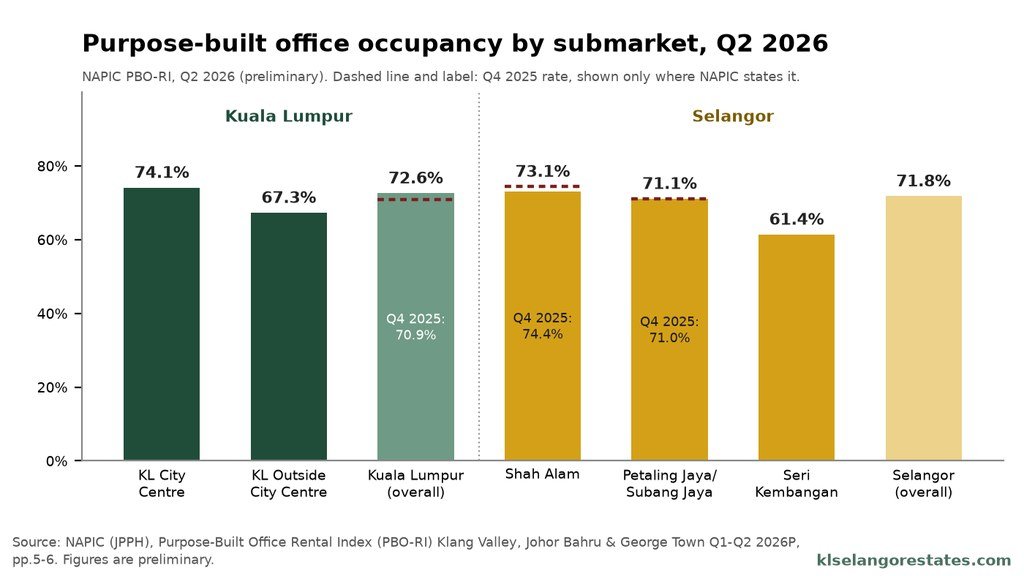
Kuala Lumpur. NAPIC reports that occupancy in KL’s purpose-built offices rose to 72.6% in Q2 2026, from 70.9% in the fourth quarter of 2025. The City Centre was higher at 74.1%, and Outside City Centre lower at 67.3%. The report does not give Q4 2025 figures for the two KL submarkets.
Selangor. Overall occupancy was stable at 71.8%. Inside the state, the picture is mixed:
- Shah Alam: 73.1%, down slightly from 74.4% in Q4 2025. NAPIC says the dip is “possibly underscoring the increasing competitive pressure and ongoing rationalisation of space within the submarket.”
- Petaling Jaya/Subang Jaya: 71.1%, up slightly from 71.0%.
- Seri Kembangan: 61.4%, which NAPIC describes as stable. It is the lowest of the five Klang Valley submarkets.
What the occupancy figures mean in plain terms. At 72.6%, about 27 of every 100 square metres in NAPIC’s Kuala Lumpur figure were not occupied (calc: 100% − 72.6%). In Seri Kembangan it was nearly 39 of every 100 (calc: 100% − 61.4%). That is a lot of choice for tenants, even after the improvement in KL.
A second NAPIC occupancy figure, and why it differs
NAPIC’s Property Market Report First Half 2026 also publishes office occupancy, using a wider count: all purpose-built offices, private and government. On that basis, at end-June 2026:
- WP Kuala Lumpur: 73.8% occupied (7,544,338 sq m occupied out of 10,223,411 sq m).
- Selangor: 73.4% occupied (3,457,295 sq m out of 4,712,837 sq m).
- Malaysia: 78.5%, up from 78.1% in H2 2025.
These are not the same series as the PBO-RI, so the numbers differ slightly. Both point the same way: roughly a quarter of office space in KL and Selangor is not occupied.
Rents: what the averages say
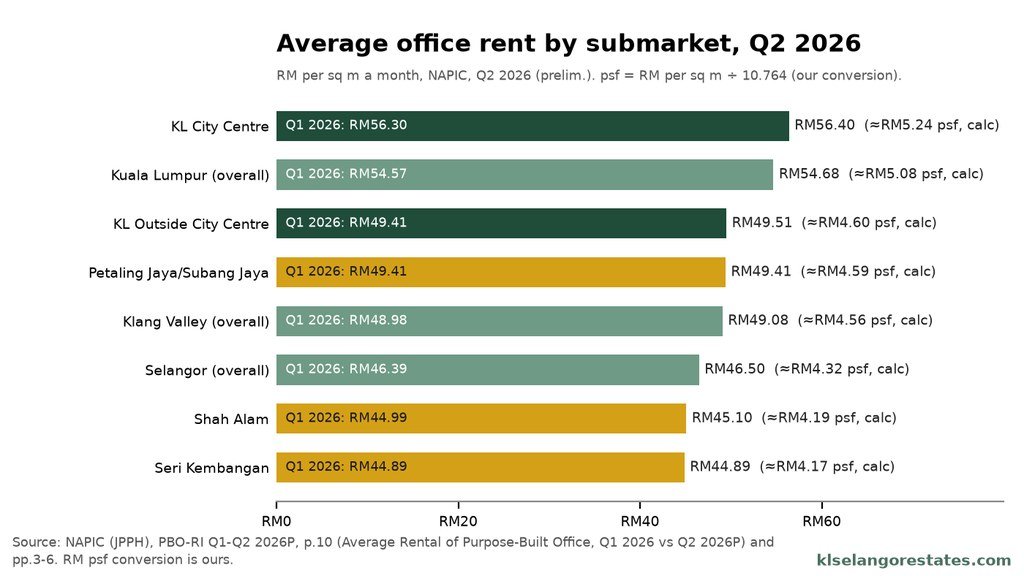
| Submarket | Q1 2026 (RM p.s.m.) | Q2 2026P (RM p.s.m.) | Q2 2026P in RM psf (calc) |
|---|---|---|---|
| KL City Centre | 56.30 | 56.40 | 5.24 |
| KL Outside City Centre | 49.41 | 49.51 | 4.60 |
| Kuala Lumpur | 54.57 | 54.68 | 5.08 |
| Petaling Jaya/Subang Jaya | 49.41 | 49.41 | 4.59 |
| Shah Alam | 44.99 | 45.10 | 4.19 |
| Seri Kembangan | 44.89 | 44.89 | 4.17 |
| Selangor | 46.39 | 46.50 | 4.32 |
| Klang Valley | 48.98 | 49.08 | 4.56 |
Three things stand out:
- Quarter to quarter, the averages moved by RM0.11 p.s.m. at most, and two did not move at all. PJ/Subang Jaya and Seri Kembangan were unchanged from Q1 2026.
- PJ/Subang Jaya and KL Outside City Centre are almost level. RM49.41 against RM49.51, a gap of RM0.10 p.s.m. (calc). If you are weighing a KL fringe location against PJ or Subang Jaya, NAPIC’s averages do not show a big rent saving either way.
- The City Centre premium is modest. KL City Centre’s average is RM6.89 p.s.m. above Outside City Centre (calc: 56.40 − 49.51), or about 14% higher (calc).
To put the averages in money terms: at the KL overall average of RM54.68 p.s.m., an illustrative 300 sq m (about 3,229 sq ft) office would be about RM16,404 a month in rent (calc: 300 × 54.68). Real quotes will differ from building to building, and may or may not include the service charge. This is only a way to read the average, not a price for any office.
The rental index: barely moving for three years
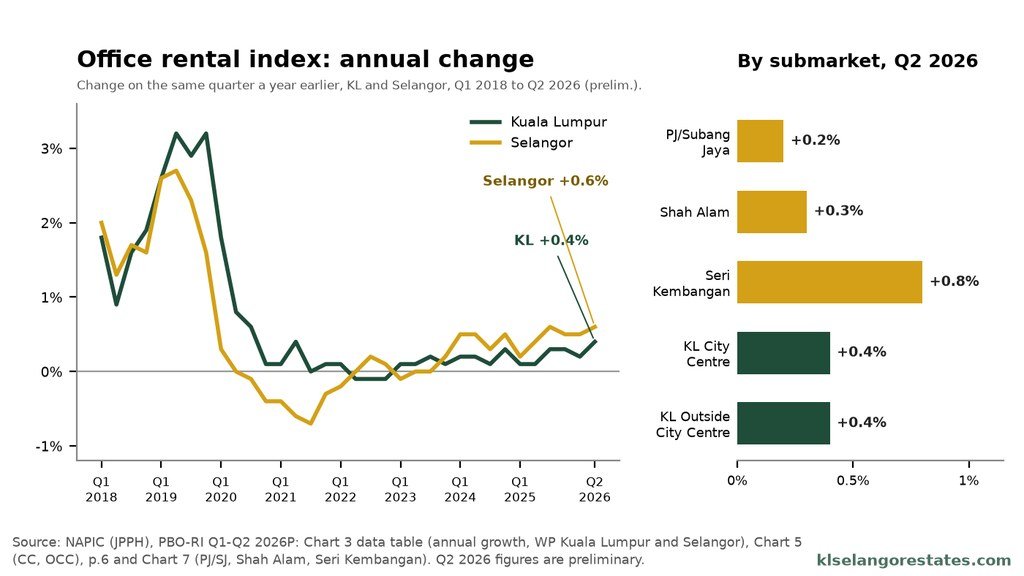
The index is the better guide to direction, because it is built to track change over time. In Q2 2026:
| Area | Index, Q2 2026P | Change on a year earlier | Change on Q1 2026 |
|---|---|---|---|
| Kuala Lumpur | 141.7 | +0.4% | +0.2% |
| KL City Centre | 142.2 | +0.4% | +0.2% |
| KL Outside City Centre | 140.0 | +0.4% | +0.2% |
| Selangor | 126.3 | +0.6% | +0.2% |
| Petaling Jaya/Subang Jaya | 131.0 | +0.2% | +0.1% |
| Shah Alam | 120.1 | +0.3% | +0.1% |
| Seri Kembangan | 127.4 | +0.8% | +0.1% |
| Klang Valley | 132.3 | +0.5% | +0.2% |
The longer series in the report puts this in context:
- 2018 and 2019: annual growth in KL ran between 0.9% and 3.2%, and in Selangor between 1.3% and 2.7%.
- 2020 to 2022: growth faded. Selangor’s index was lower than a year earlier in every quarter from Q3 2020 to Q1 2022, by as much as 0.7% in Q3 2021. KL dipped slightly below zero (−0.1%) from Q2 to Q4 2022.
- 2023 to mid-2026: both moved within a narrow band. KL’s annual change has been between 0.1% and 0.4% in every quarter since Q1 2023, and Selangor’s between −0.1% and 0.6%.
Over eight years, NAPIC’s average rent for KL went from RM52.00 p.s.m. in Q2 2018 to RM54.68 in Q2 2026, about 5% higher (calc). Selangor went from RM44.91 to RM46.50, about 3.5% higher (calc). In both cases that averages well under 1% a year (calc).
This is not a crash, and it is not a boom. NAPIC itself describes the Q2 2026 index as showing “marginal upward movements” in “a generally stable landscape”.
What NAPIC says is driving the market
NAPIC’s overview gives its reading of the market. In summary:
- Tenants are selective. Occupiers are “prioritising well-located buildings with modern specifications, green features and flexible space configurations that support hybrid working arrangements.” Cost and space efficiency are driving decisions, and take-up has been cautious.
- Demand is being reshaped by corporate tenants rationalising space, continued work-from-home practices and the growth of co-working operators.
- Older buildings are under more pressure. Newer, well-managed buildings have held up better, while “older office stock faced increasing competitive pressure amid ample supply in major urban centres.”
- Landlords are competing. NAPIC says landlords have responded with building upgrades, flexible leasing terms and value-added services, “contributing to a highly competitive leasing environment.”
Supply: what is coming
From NAPIC’s Property Market Report First Half 2026 (Central Region), as at end-June 2026:
| Existing | Incoming (under construction) | Planned | |
|---|---|---|---|
| WP Kuala Lumpur | 461 buildings, 10,223,411 sq m | 18 buildings, 775,380 sq m | 14 buildings, 547,109 sq m |
| Selangor | 278 buildings, 4,712,837 sq m | 1 building, 19,088 sq m | 1 building, 14,948 sq m |
- No new purpose-built office buildings were completed in the Central Region in H1 2026, NAPIC says. Nationwide, four were completed, adding 81,517 sq m, none of them in KL or Selangor.
- KL’s pipeline is large relative to Selangor’s. Incoming supply in KL equals about 7.6% of its existing office space (calc: 775,380 ÷ 10,223,411). Nationally, KL accounts for 72.5% of incoming office supply. In Selangor, incoming supply is about 0.4% of existing space (calc).
For KL tenants, that pipeline is relevant: as new buildings complete, landlords of existing buildings will be competing for the same occupiers. For Selangor, NAPIC’s figures show very little new supply, so the competition there is mainly between existing buildings.
What this means if you are renewing or relocating in 2027
NAPIC’s data does not tell you what your landlord will accept. It does tell you that, on average, rents are flat, a quarter or more of space is empty, and NAPIC itself calls the leasing market highly competitive. That is a reasonable basis for asking for better terms, especially in older buildings and in submarkets with lower occupancy.
Checklist for tenants
- Check your current lease first. Find the option-to-renew clause and its notice deadline. Many options must be exercised in writing by a set date before expiry; miss it and you lose the option.
- Start early. Give yourself time to compare at least two or three alternatives, even if you expect to stay. A credible alternative is your best negotiating tool.
- Benchmark sensibly. Use NAPIC’s submarket averages as a reference point, not a target. Your building may be above or below average for good reasons: age, specification, access, car parks and management.
- Ask for a rent-free fit-out period if you are moving or doing major works. Agree in writing whether service charges and utilities are payable during that period.
- Look at the rent review clause. Is the rent fixed for the term, stepped up by agreed amounts, or reviewed to “market”? If there is a market review, ask for a cap and a clear method.
- Consider a break clause. If your headcount is uncertain, a right to end the lease early, with a stated notice period and any penalty spelt out, can be worth more than a small rent cut.
- Pin down reinstatement. Agree what condition you must return the space in (for example, bare shell or as-is), who decides, and what happens to fixtures the landlord wants to keep. Record the handover condition with dated photos and a schedule.
- Understand the service charge. Ask what it covers, how often and on what basis it can be revised, and what after-hours air-conditioning costs.
- Car parks. Confirm how many bays come with the space, the monthly charge per bay, and whether that charge can change during the term.
- Deposits. The number of months of security and utility deposit is negotiable. Agree when and how it is refunded.
- Service tax. Check whether the rent and service charge will carry service tax (see below), and whether your business qualifies for an exemption.
- Stamp duty. The tenant is normally the party liable for stamp duty on the lease. Budget for it (see below).
- Get the lease reviewed by your own lawyer before you sign, and keep a full set of the signed, stamped documents.
Checklist for owners pricing space in PJ/Subang Jaya, Shah Alam and Seri Kembangan
- Price against your own competition, not the headline. PJ/Subang Jaya’s average is RM49.41 p.s.m., Shah Alam’s RM45.10 and Seri Kembangan’s RM44.89. Asking well above your submarket average needs a reason a tenant can see.
- Expect tenants to compare across the border. PJ/Subang Jaya’s average is within RM0.10 p.s.m. of KL Outside City Centre’s (calc), so a PJ tenant may also be looking at KL fringe space.
- Seri Kembangan needs the most care. Occupancy is 61.4%, the lowest in the Klang Valley, even though its index rose the most (+0.8% a year). Higher growth from a lower base does not mean tenants are easy to find.
- Shah Alam occupancy slipped from 74.4% to 73.1%. If you have vacant space there, flexibility on fit-out periods and terms may matter more than the headline rent.
- Older buildings: invest or discount. NAPIC’s own reading is that newer, well-managed buildings with modern specifications and green features are holding up better. Upgrades, better management and flexible layouts match what NAPIC says occupiers are prioritising.
- Total cost matters to tenants. Service charges, car park charges, service tax and reinstatement obligations all count in a tenant’s comparison. Being clear on them up front saves time.
Service tax on rent: now 6%
Rental and leasing services are subject to service tax. The Ministry of Finance announced on 5 January 2026 that, with effect from 1 January 2026, the service tax rate on rental or leasing was reduced from 8% to 6%. It also raised the annual sales threshold below which SME tenants are exempt from service tax on rent from RM1 million to RM1.5 million, and newly set-up SMEs get a one-year exemption on rental or leasing services from the date their company is registered.
As an illustration, 6% on a monthly rent of RM16,404 would be about RM984 (calc). Whether service tax actually applies to your lease depends on your landlord’s and your business’s circumstances, so check your invoices and ask your tax adviser.
Stamp duty on an office lease
A lease or tenancy agreement must be stamped, and under the Third Schedule of the Stamp Act 1949 the tenant (lessee) is normally the party liable. The rates in Item 49(a) of the First Schedule, as amended by the Finance Act 2024, are based on a year’s rent, for every RM250 or part of RM250:
| Lease term | Duty per RM250 of a year’s rent |
|---|---|
| Up to 1 year | RM1 |
| Over 1 year, up to 3 years | RM3 |
| Over 3 years, up to 5 years | RM5 |
| Over 5 years, or indefinite | RM7 |
Example (calc). An illustrative three-year lease at RM16,000 a month has a year’s rent of RM192,000. That is 768 units of RM250, so the duty is 768 × RM3 = RM2,304.
Since 1 January 2026, tenancy and lease agreements are stamped under LHDN’s self-assessment system on MyTax. I explain the deadlines and penalties in my stamp duty self-assessment article. If you renew in 2027, the duty is worked out again on the new rent and term.
What NAPIC’s numbers do not show
- Any building’s asking rent or occupancy. The PBO-RI publishes averages and an index for each submarket. It does not tell you what a particular building is charging or how full it is.
- Incentives. Rent-free periods, fit-out contributions and other concessions are not in the averages, so the rent a tenant effectively pays may differ from the figure on paper.
- Strata offices, shop offices and SOHOs. The index covers purpose-built office buildings.
- Grade. The report does not split the averages by building age or grade.
- Every location. Places outside NAPIC’s five Klang Valley submarkets, such as Cyberjaya or Putrajaya, are not covered by the PBO-RI averages.
- The future. An index is a record of the past, not a forecast or a guarantee. The Q2 2026 figures are also preliminary and may be revised.
What to watch next
- NAPIC’s next PBO-RI release, to see whether KL’s occupancy gain holds and whether Shah Alam’s dip continues.
- NAPIC’s full-year 2026 Property Market Report, for updated office supply and occupancy.
- Completions in KL’s 775,380 sq m pipeline, which will add choice for tenants as they open.
- Any change to service tax on rent in future budgets or MOF announcements.
Related reading
- Stamp duty self-assessment in Malaysia from 2027
- Klang Valley shophouse prices: what NAPIC’s shop price index shows
- Selangor SME factories: buy or rent?
- Data centres vs SMEs: what is happening to Selangor’s factories
Sources
All accessed 31 October 2026.
- NAPIC (JPPH), Purpose-Built Office Rental Index (PBO-RI) Klang Valley, Johor Bahru & George Town Q1–Q2 2026P (dated 7 September 2026), Overview and pp. 1–10, Charts 1–8: https://napic.jpph.gov.my/storage/app/media/3-penerbitan/Shahrul/Bahagian%20Indeks%20Harta%20Tanah/Laporan%20Jadual%20PBORI/Q2%202026/PBO-RI%20Report%20Q1-Q2%202026P.pdf
- NAPIC (JPPH), Property Market Report First Half 2026: Overview section 2.2.4 Purpose-Built Office (pp. 28–30, Charts 37 and 38) and Central Region, Purpose-built Office (pp. 19–20, Chart 20 and Table 9): https://napic.jpph.gov.my/storage/app/media/3-penerbitan/Shahrul/Bahagian%20Pasaran%20Harta%20Tanah/Laporan%20Pasaran%20Harta%20Separuh%20Tahun%20dan%20Jadual/Q2%202026/LAPORAN%20PASARAN%20HARTA%20H1%202026.pdf
- Ministry of Finance (Bernama), “SST Perkhidmatan Sewaan Diturunkan Kepada 6 Peratus, PMKS Terima Pelepasan Baharu”, 5 January 2026: https://mof.gov.my/portal/ms/berita/akhbar/sst-perkhidmatan-sewaan-diturunkan-kepada-6-peratus-pmks-terima-pelepasan-baharu
- Finance Act 2024, section 27 (amendment of the First Schedule to the Stamp Act 1949, Item 49): https://mylaw.my/legislation/akta-kewangan-2024/section-27
- Stamp Act 1949 (Act 378), First and Third Schedules: https://mylaw.my/legislation/stamp-act-1949/section-36
About the author
Jessica Leong | Registered Estate Agent E3208
PropNex Realty Sdn Bhd (E (1) 1800/1)
KLCC branch, Marc Residence, Jalan Pinang, Kuala Lumpur
010-464 6088 (call/WhatsApp) · Office: 03-2161 8608
Website: klselangorestates.com
Jessica covers new launch condos in Kuala Lumpur and Selangor, industrial property in Selangor, bank auction (lelong) properties, and Selangor offices, shophouses and en-bloc deals. See her new launch pages for Kuala Lumpur, KLCC, Petaling Jaya and Selangor.
This article is general information based on public sources as at 31 October 2026. It is not legal, tax, financial or investment advice. NAPIC’s Q2 2026 figures are preliminary and subject to revision. NAPIC’s averages describe purpose-built offices in each submarket and are not the asking rent or occupancy of any particular building. This article does not promote or assess any particular building or development. Please do your own checks and consult your own lawyer, tax adviser or valuer before you sign, renew or price a lease.